The quantitative data Thoreau collected for his river project of 1859-1860 was so voluminous that we could not publish it as appendices for The Boatman, especially because the plan was to market it as a trade book. Nevertheless, as a scientist, I found it essential that the reader have easy access to his raw data so that they could independently verify or refute my conclusions.
This site contains twenty four tables of data (and five graphs drawn from that data) that I compiled and analyzed in order to understand what Thoreau’s methods and results were. They are listed in roughly the same order he collected the data. These 24 tables (and 5 charts) show only a minimum compilation of the data he collected, those data I deemed essential to my text.
Each of these tables and charts is cross-referenced to page numbers in The Boatman so that you can examine the data while reading the text.
Table 1 – River Surface Profiles for Two Different 1859 Floods (Boatman, page 153)
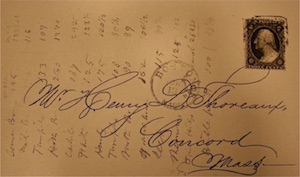
Table 2 – Inter-bridge Distances on Envelope (Boatman, pages, 28, 157)
Table 3 – Botanical transects of Concord’s Great Meadow (Boatman, page 158)
Table 4 – Rainfall vs. Stage of Sudbury River at Saddle Rock, May 24-Oct 15, 1859 (Boatman, page 159) and Tablechart 4a – Stage at Saddle Rock, Wayland (Boatman, pages 159-160)
Table 5 – Bridge Statistics Final (Boatman, pages 160-162)
Table 6 – Average River Depth by Reach July 31 (Boatman, page 172)
Table 7 – Summary Description of River Reaches (Boatman, pages 180-184)
Table 8 – Deep Holes Between Pelham Pond and Billerica (Boatman, pages 180-184, 187)
Table 9 – Interbridge Distances along Thread of River (Boatman, pages 180-184)
Table 10 – River Gradients by Reach (Boatman, pages 180-184)
Table 11 – Shallows along Sudbury River (Boatman, pages 180-184)
Table 12 – Great Bends along Sudbury River (Boatman, pages 180-184)
Table 13 – Current Velocities, General (Boatman, pages 188-189)
Table 14 – Vertical Gradients in Current Velocity (Boatman, pages 188-189)
Table 15 – Discharges from Compensating Reservoirs and lake Cochituate (Boatman, page 190)
Table 16 – Initial Stage Monitoring for Flood of June 22-28, 1859, Lower Sudbury River (pages 153, 192) and Tablechart 16a – Initial Stage Monitoring for Flood of June 22-28, 1859, Lower Sudbury River (Boatman, pages 153, 192)
Table 17 – Stage Monitoring at Three Stations for July 25-Aug 15, 1859 (pages 192-194) and Tablechart 17a – Stage Boat Place July 31-Aug 5 (pages 192-194) and Tablechart 17b – Stage July 31-August 15 (pages 192-194) and Tablechart 17c – Stage at Three Stations (Boatman, pages 192-194)
Table 18 – Preliminary Stage Monitoring July 31-August 5 (Boatman, Pages 192-194)
Table 19 – Winter Ice Openings on December 29, 1959 (Boatman, page 208)
Table 20 – Third Program of Stage Monitoring, August 18-September 25, 1859 (Boatman, pages 211-213)
Table 21 – Third Program continued, 1860-1861 (Boatman, pages; last two chapters)
Table 22 – Thermal Study of Brooks, River, Springs, and Air (Boatman, pages 214-216)
Table 23 – Historic Changes to Bridges and Meadows (Boatman, pages 161-162)
Table 24 – Dates of River Breakup, 1850-1856 (Boatman, pages 136-137)
Table 25 – Threshold Current Velocities for Sediment Transport (Boatman, 196, note 28 on page 285)
Envelope of letter sent to Thoreau and then covered with calculations. Courtesy of the Concord Free Public Library.